Is That Amazon Deal Really a Deal?
You see it all the time on Amazon.
Was £79.99 — Now £49.99 — Save 38%.
It looks like a bargain.
But there is one problem: you don’t know whether £49.99 is actually a good price.
The “was” price doesn’t tell you what the product normally sells for. A product might have been £49.99 for weeks before being advertised as a special deal.
So before you click Buy Now, there is a simple question worth asking:
What has this product actually cost over the last few months?
That’s where an Amazon price history tracker such as Keepa becomes extremely useful.
An Amazon deal may look impressive at first glance, but checking the price history can reveal whether you’re actually getting a good deal.
What Is Amazon Price History?
Amazon prices can change frequently.
A product might be:
– £59.99 on Monday
– £54.99 on Wednesday
– £44.99 during a promotion
– £59.99 again the following week
Looking only at today’s price doesn’t tell you whether £44.99 is a genuine bargain.
A price-history chart lets you look backwards and see how the price has changed over time.
This gives you something much more useful than a large red discount percentage: context.
The Easiest Way to Check an Amazon Product’s Price History
One of the best-known tools for this is Keepa.
Keepa provides Amazon price-history charts and price-drop alerts, and its browser extension can display price-history information directly on supported Amazon product pages.
Step 1: Find the Product on Amazon
Go to Amazon UK and find the product you are considering.
Don’t buy it yet.
Copy the product’s Amazon page URL or use the Keepa extension if you have it installed.
Step 2: Open the Price History
With Keepa, you can view the product’s historical pricing information.
Instead of seeing only today’s price, you can see how the price has moved over time.
This is the part that can completely change your buying decision.
Step 3: Look at the Bigger Picture
Don’t just look at the lowest price.
Look for patterns.
Ask yourself:
– Is today’s price close to the usual price?
– Has the product been cheaper recently?
– Does the price regularly fall during certain periods?
– Is today’s “sale” price actually unusual?
These questions are much more useful than simply looking at the percentage discount shown on Amazon.
How to Read a Keepa Price Chart
At first, a price-history graph can look complicated.
You don’t need to understand every line. For a normal shopper, concentrate on three things.
1. Today’s Price
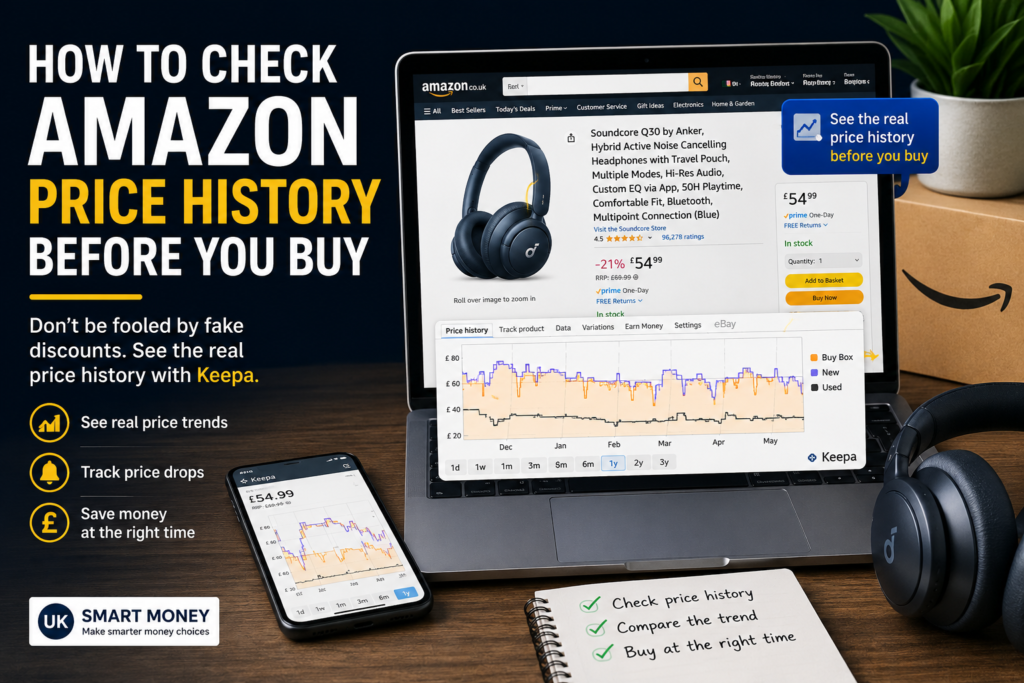
Take the Anker Soundcore Q30 noise-cancelling headphones as an example.
At the time of writing, the Keepa data shows a current Buy Box price of £54.99.
That number by itself doesn’t tell you much.
2. The Normal Price Range
Look at where the price has spent most of its time.
For the Q30, Keepa shows an average price of £52.57 over the last 180 days and £55.82 over the last 365 days.
At £54.99, the Q30 is therefore sitting very close to its typical selling price.
In other words, it doesn’t appear to be an exceptional deal based on its recent price history.
3. The Historical Low
Look for the lowest prices the product has reached.
The Q30’s lowest price shown over the past year was £40.84, around eight months ago.
That doesn’t mean you should wait forever for £40.84.
But it does tell you something important: £54.99 is not close to the best price this product has reached.
The important question is whether the current price is good compared with the product’s normal history, not whether it’s the lowest price it has ever been.
Keepa price history for the Anker Soundcore Q30, showing the current Buy Box price, 180-day average and one-year low.
Keepa price history for Anker Soundcore Q30 showing £54.99 current price, £52.57 180-day average and £40.84 one-year low.”
Example: A “£30 Saving” That Isn’t Really £30
Imagine Amazon shows:
Was £79.99
Now £49.99
Save £30
That sounds impressive.
But suppose the price history shows something like this:
– £49.99 for most of January
– £54.99 in February
– £49.99 in March
– £59.99 in April
– £49.99 today
Suddenly, the £30 saving doesn’t look quite as exciting.
You’re not necessarily getting a bad price. You’re simply not getting the spectacular bargain the discount label might suggest.
That’s why checking historical pricing is so useful.
A Better Question to Ask
Instead of asking:
“How much money am I saving?”
ask:
“Is this one of the better prices this product has been sold for?”
That’s a much better way to think about Amazon deals.
The difference is subtle but important.
A £20 discount isn’t automatically a good deal. A product costing £20 less than its previous price can still be poor value if the product itself isn’t worth £20.
Check the Current Amazon Price
If you’ve checked the price history and you’re happy with the deal, you can check the latest Amazon UK price before buying.
“CHECK THE ANKER SOUNDCORE Q30 ON AMAZON UK” (https://amzn.to/4ql6VEV)
Remember that Amazon prices can change at any time, so always check the current price on the product page before purchasing.
Don’t Make This Mistake With Amazon Price History
There is one important limitation: price history does not tell you whether a product is good.
It only helps you understand the price.
A product can be at its lowest historical price and still be a bad purchase.
Before buying, you should also consider:
– Customer reviews
– Review quality rather than just the star rating
– Product specifications
– Seller reputation
– Warranty
– Return policy
– Whether you actually need the product
Price history should be one part of your decision, not the entire decision.
Keepa Can Also Alert You When the Price Drops
One of the most useful features of Keepa is price-drop tracking.
Instead of repeatedly checking Amazon yourself, you can set up an alert for a product you’re interested in.
For example, you might decide:
“I’ll buy this if it drops below £40.”
Rather than paying £49.99 today, you can wait and let the price tracker notify you if the price reaches your target.
This can be particularly useful for more expensive products where waiting for a price drop could save you a meaningful amount of money.
Keepa Isn’t the Only Option
Keepa is not the only tool available for checking Amazon prices.
Two alternatives worth knowing about are:
CamelCamelCamel
A free Amazon price tracker that provides price-history charts and price-drop alerts.
Honey
A shopping browser extension that can track prices and provide shopping-related features across supported retailers.
Keepa remains one of the more detailed options for analysing Amazon price history, but it’s worth knowing that you have alternatives.
Should You Bother Checking Price History?
If you regularly shop on Amazon, it’s worth building into your routine.
You don’t have to check the price history of every £5 purchase.
But for more expensive products — TVs, laptops, phones, power tools, kitchen appliances, headphones, cameras and smart home equipment — checking the historical price takes only a minute and could prevent you from buying at the wrong time.
Before purchasing an expensive item, use this quick process:
1. Find the product.
2. Check the current price.
3. Check the historical price.
4. Compare today’s price with the normal range.
5. Check whether it has recently been cheaper.
6. Decide whether you actually need it.
7. Only then decide whether to buy.
Final Verdict
Amazon’s discount percentage can be useful, but it shouldn’t be the only thing you look at.
A product saying “Save 40%” doesn’t automatically mean you’re getting a 40% bargain.
Checking the price history gives you a much better idea of what the product normally costs and whether today’s price is genuinely attractive.
Next time you see an Amazon “deal”, don’t immediately reach for your wallet.
Check the history first.
Disclosure
Some links on UK Smart Money may be affiliate links. If you purchase something through one of these links, we may receive a commission at no additional cost to you.
We only recommend tools and services that we believe can be useful to our readers.
 Keepa price history for the Anker Soundcore Q30, showing the current Buy Box price, 180-day average and one-year low.
Keepa price history for Anker Soundcore Q30 showing £54.99 current price, £52.57 180-day average and £40.84 one-year low.”
Example: A “£30 Saving” That Isn’t Really £30
Imagine Amazon shows:
Was £79.99
Now £49.99
Save £30
That sounds impressive.
But suppose the price history shows something like this:
– £49.99 for most of January
– £54.99 in February
– £49.99 in March
– £59.99 in April
– £49.99 today
Suddenly, the £30 saving doesn’t look quite as exciting.
You’re not necessarily getting a bad price. You’re simply not getting the spectacular bargain the discount label might suggest.
That’s why checking historical pricing is so useful.
A Better Question to Ask
Instead of asking:
“How much money am I saving?”
ask:
“Is this one of the better prices this product has been sold for?”
That’s a much better way to think about Amazon deals.
The difference is subtle but important.
A £20 discount isn’t automatically a good deal. A product costing £20 less than its previous price can still be poor value if the product itself isn’t worth £20.
Check the Current Amazon Price
If you’ve checked the price history and you’re happy with the deal, you can check the latest Amazon UK price before buying.
“CHECK THE ANKER SOUNDCORE Q30 ON AMAZON UK” (https://amzn.to/4ql6VEV)
Remember that Amazon prices can change at any time, so always check the current price on the product page before purchasing.
Don’t Make This Mistake With Amazon Price History
There is one important limitation: price history does not tell you whether a product is good.
It only helps you understand the price.
A product can be at its lowest historical price and still be a bad purchase.
Before buying, you should also consider:
– Customer reviews
– Review quality rather than just the star rating
– Product specifications
– Seller reputation
– Warranty
– Return policy
– Whether you actually need the product
Price history should be one part of your decision, not the entire decision.
Keepa Can Also Alert You When the Price Drops
One of the most useful features of Keepa is price-drop tracking.
Instead of repeatedly checking Amazon yourself, you can set up an alert for a product you’re interested in.
For example, you might decide:
“I’ll buy this if it drops below £40.”
Rather than paying £49.99 today, you can wait and let the price tracker notify you if the price reaches your target.
This can be particularly useful for more expensive products where waiting for a price drop could save you a meaningful amount of money.
Keepa Isn’t the Only Option
Keepa is not the only tool available for checking Amazon prices.
Two alternatives worth knowing about are:
CamelCamelCamel
A free Amazon price tracker that provides price-history charts and price-drop alerts.
Honey
A shopping browser extension that can track prices and provide shopping-related features across supported retailers.
Keepa remains one of the more detailed options for analysing Amazon price history, but it’s worth knowing that you have alternatives.
Should You Bother Checking Price History?
If you regularly shop on Amazon, it’s worth building into your routine.
You don’t have to check the price history of every £5 purchase.
But for more expensive products — TVs, laptops, phones, power tools, kitchen appliances, headphones, cameras and smart home equipment — checking the historical price takes only a minute and could prevent you from buying at the wrong time.
Before purchasing an expensive item, use this quick process:
1. Find the product.
2. Check the current price.
3. Check the historical price.
4. Compare today’s price with the normal range.
5. Check whether it has recently been cheaper.
6. Decide whether you actually need it.
7. Only then decide whether to buy.
Final Verdict
Amazon’s discount percentage can be useful, but it shouldn’t be the only thing you look at.
A product saying “Save 40%” doesn’t automatically mean you’re getting a 40% bargain.
Checking the price history gives you a much better idea of what the product normally costs and whether today’s price is genuinely attractive.
Next time you see an Amazon “deal”, don’t immediately reach for your wallet.
Check the history first.
Disclosure
Some links on UK Smart Money may be affiliate links. If you purchase something through one of these links, we may receive a commission at no additional cost to you.
We only recommend tools and services that we believe can be useful to our readers.
Keepa price history for the Anker Soundcore Q30, showing the current Buy Box price, 180-day average and one-year low.
Keepa price history for Anker Soundcore Q30 showing £54.99 current price, £52.57 180-day average and £40.84 one-year low.”
Example: A “£30 Saving” That Isn’t Really £30
Imagine Amazon shows:
Was £79.99
Now £49.99
Save £30
That sounds impressive.
But suppose the price history shows something like this:
– £49.99 for most of January
– £54.99 in February
– £49.99 in March
– £59.99 in April
– £49.99 today
Suddenly, the £30 saving doesn’t look quite as exciting.
You’re not necessarily getting a bad price. You’re simply not getting the spectacular bargain the discount label might suggest.
That’s why checking historical pricing is so useful.
A Better Question to Ask
Instead of asking:
“How much money am I saving?”
ask:
“Is this one of the better prices this product has been sold for?”
That’s a much better way to think about Amazon deals.
The difference is subtle but important.
A £20 discount isn’t automatically a good deal. A product costing £20 less than its previous price can still be poor value if the product itself isn’t worth £20.
Check the Current Amazon Price
If you’ve checked the price history and you’re happy with the deal, you can check the latest Amazon UK price before buying.
“CHECK THE ANKER SOUNDCORE Q30 ON AMAZON UK” (https://amzn.to/4ql6VEV)
Remember that Amazon prices can change at any time, so always check the current price on the product page before purchasing.
Don’t Make This Mistake With Amazon Price History
There is one important limitation: price history does not tell you whether a product is good.
It only helps you understand the price.
A product can be at its lowest historical price and still be a bad purchase.
Before buying, you should also consider:
– Customer reviews
– Review quality rather than just the star rating
– Product specifications
– Seller reputation
– Warranty
– Return policy
– Whether you actually need the product
Price history should be one part of your decision, not the entire decision.
Keepa Can Also Alert You When the Price Drops
One of the most useful features of Keepa is price-drop tracking.
Instead of repeatedly checking Amazon yourself, you can set up an alert for a product you’re interested in.
For example, you might decide:
“I’ll buy this if it drops below £40.”
Rather than paying £49.99 today, you can wait and let the price tracker notify you if the price reaches your target.
This can be particularly useful for more expensive products where waiting for a price drop could save you a meaningful amount of money.
Keepa Isn’t the Only Option
Keepa is not the only tool available for checking Amazon prices.
Two alternatives worth knowing about are:
CamelCamelCamel
A free Amazon price tracker that provides price-history charts and price-drop alerts.
Honey
A shopping browser extension that can track prices and provide shopping-related features across supported retailers.
Keepa remains one of the more detailed options for analysing Amazon price history, but it’s worth knowing that you have alternatives.
Should You Bother Checking Price History?
If you regularly shop on Amazon, it’s worth building into your routine.
You don’t have to check the price history of every £5 purchase.
But for more expensive products — TVs, laptops, phones, power tools, kitchen appliances, headphones, cameras and smart home equipment — checking the historical price takes only a minute and could prevent you from buying at the wrong time.
Before purchasing an expensive item, use this quick process:
1. Find the product.
2. Check the current price.
3. Check the historical price.
4. Compare today’s price with the normal range.
5. Check whether it has recently been cheaper.
6. Decide whether you actually need it.
7. Only then decide whether to buy.
Final Verdict
Amazon’s discount percentage can be useful, but it shouldn’t be the only thing you look at.
A product saying “Save 40%” doesn’t automatically mean you’re getting a 40% bargain.
Checking the price history gives you a much better idea of what the product normally costs and whether today’s price is genuinely attractive.
Next time you see an Amazon “deal”, don’t immediately reach for your wallet.
Check the history first.
Disclosure
Some links on UK Smart Money may be affiliate links. If you purchase something through one of these links, we may receive a commission at no additional cost to you.
We only recommend tools and services that we believe can be useful to our readers.